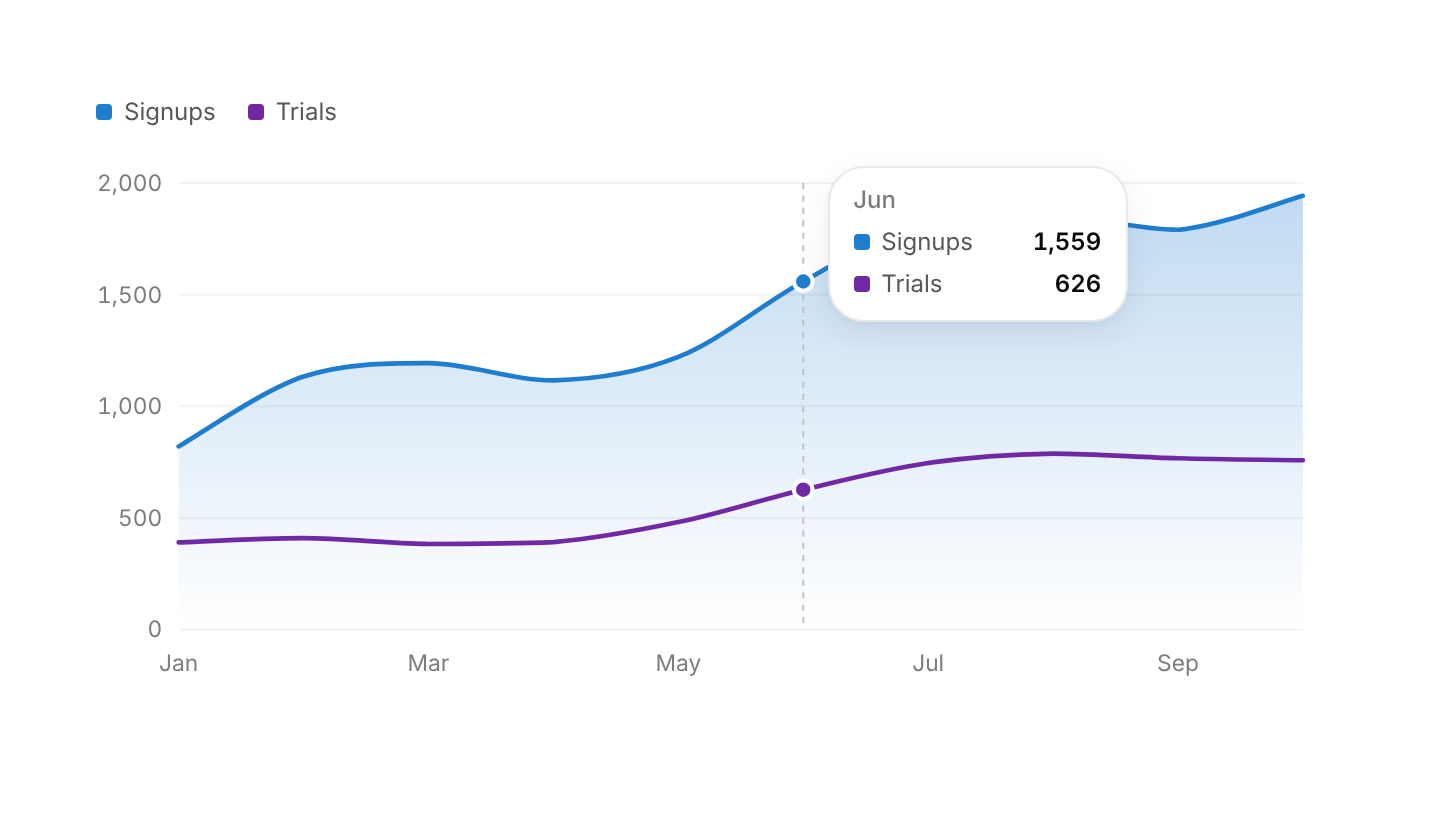
Usage
import { LineChart } from "@/registry/components/line-chart/line-chart";

<LineChart data={[/* … */]} x={/* … */} series={[/* … */]} label="…" />
Props
| Prop | Type | Default | Description |
|---|---|---|---|
data | T[] | ||
x | keyof T & string | Field used for the x axis labels | |
series | LineSeries[] | ||
label | string | Accessible summary, e.g. "Weekly signups, Jan to Jun" | |
height? | number | 260 | |
formatValue? | (v: number) => string | (v) => v.toLocaleString() | |
area? | boolean | true | Fill under the first series |
curved? | boolean | true | Draw a smooth curve instead of straight segments |
When to use
One to four series over time or another ordered axis, in dashboards and reports, up to a few hundred points.
When not to use
Categories without an order (use bar-chart); one value against a range (use gauge); dense scientific plots or zooming (use a chart library).