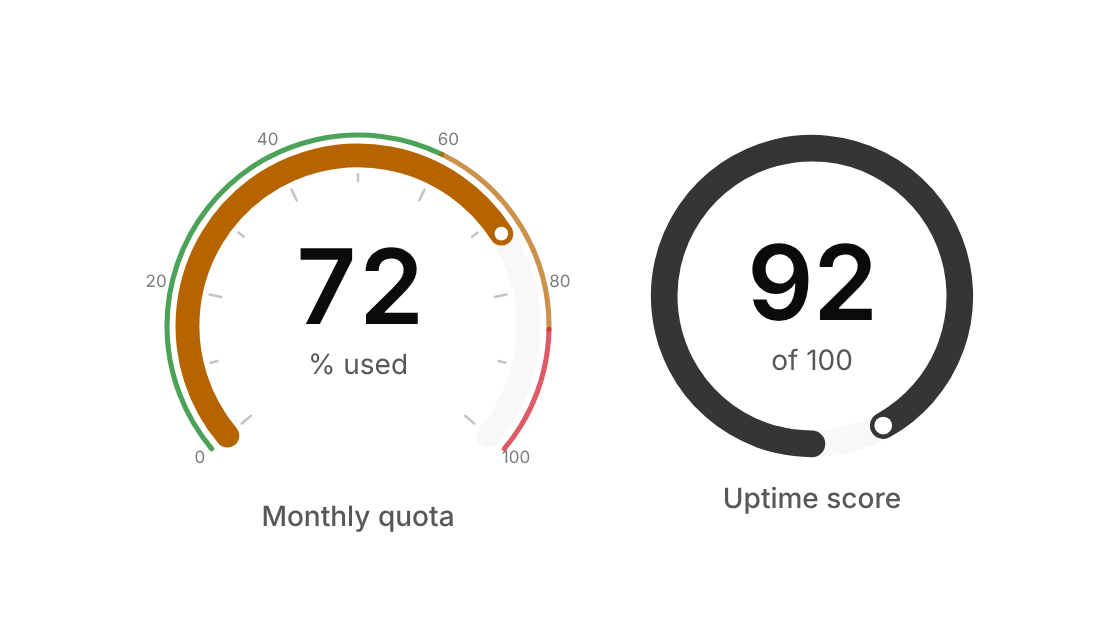
Usage
import { Gauge } from "@/registry/components/gauge/gauge";

<Gauge value={0} label="…" />
Props
| Prop | Type | Default | Description |
|---|---|---|---|
value | number | ||
min? | number | 0 | |
max? | number | 100 | |
label | string | Visible label for the reading, also the accessible name | |
caption? | ReactNode | Text under the number, e.g. a unit or status | |
format? | (value: number) => string | (v) => Math.round(v).toString() | Format the centred number |
startAngle? | number | 50 | Gauge degrees clockwise from six o'clock; 40 → 320 leaves a gap at the bottom |
endAngle? | number | 310 | |
ticks? | number | 10 | Number of tick intervals; 0 hides ticks |
bands? | GaugeBand[] | Colour the fill by range, e.g. green / amber / red | |
thickness? | number | 14 | |
size? | number | 220 |
When to use
One value against a known range: scores, quotas, utilisation, health, speed.
When not to use
Trends over time (use line-chart); comparing several categories (use bar-chart); values you want users to set (use humidity-dial).