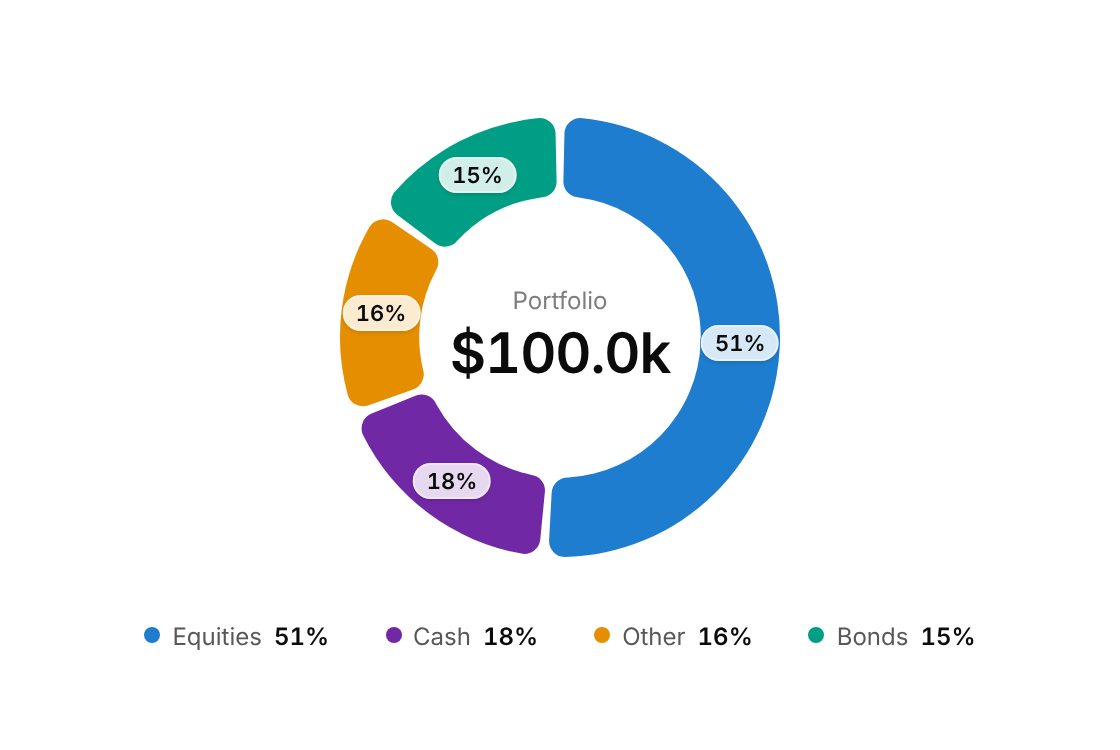
Usage
import { DonutChart } from "@/registry/components/donut-chart/donut-chart";

<DonutChart data={[/* … */]} label="…" />
Props
| Prop | Type | Default | Description |
|---|---|---|---|
data | DonutSlice[] | ||
label | string | Accessible summary of the chart | |
centerLabel? | string | "Total" | Small caption above the centre value; defaults to "Total" |
centerValue? | string | Centre value; defaults to the formatted sum of the slices | |
size? | number | 240 | Outer diameter in px |
thickness? | number | 0.36 | Ring thickness as a fraction of the radius (0.2 to 0.6) |
gap? | number | 2.5 | Gap between slices in degrees |
pillMin? | number | 0.08 | Show a percentage pill on slices of at least this share (0 to 1); set 1 to hide them |
showLegend? | boolean | true | |
formatValue? | (v: number) => string | (v) => v.toLocaleString() |
When to use
- Shares of one whole with two to about six parts: portfolio or budget allocation, traffic by source, plan mix - A dashboard card where the total matters as much as the split
When not to use
Comparing values across periods (use bar-chart); more than about six parts or parts that do not add up to a whole (use bar-chart); a single value against a target (use gauge or tick-meter).
Related
Bar chart · Gauge · Tick meter